
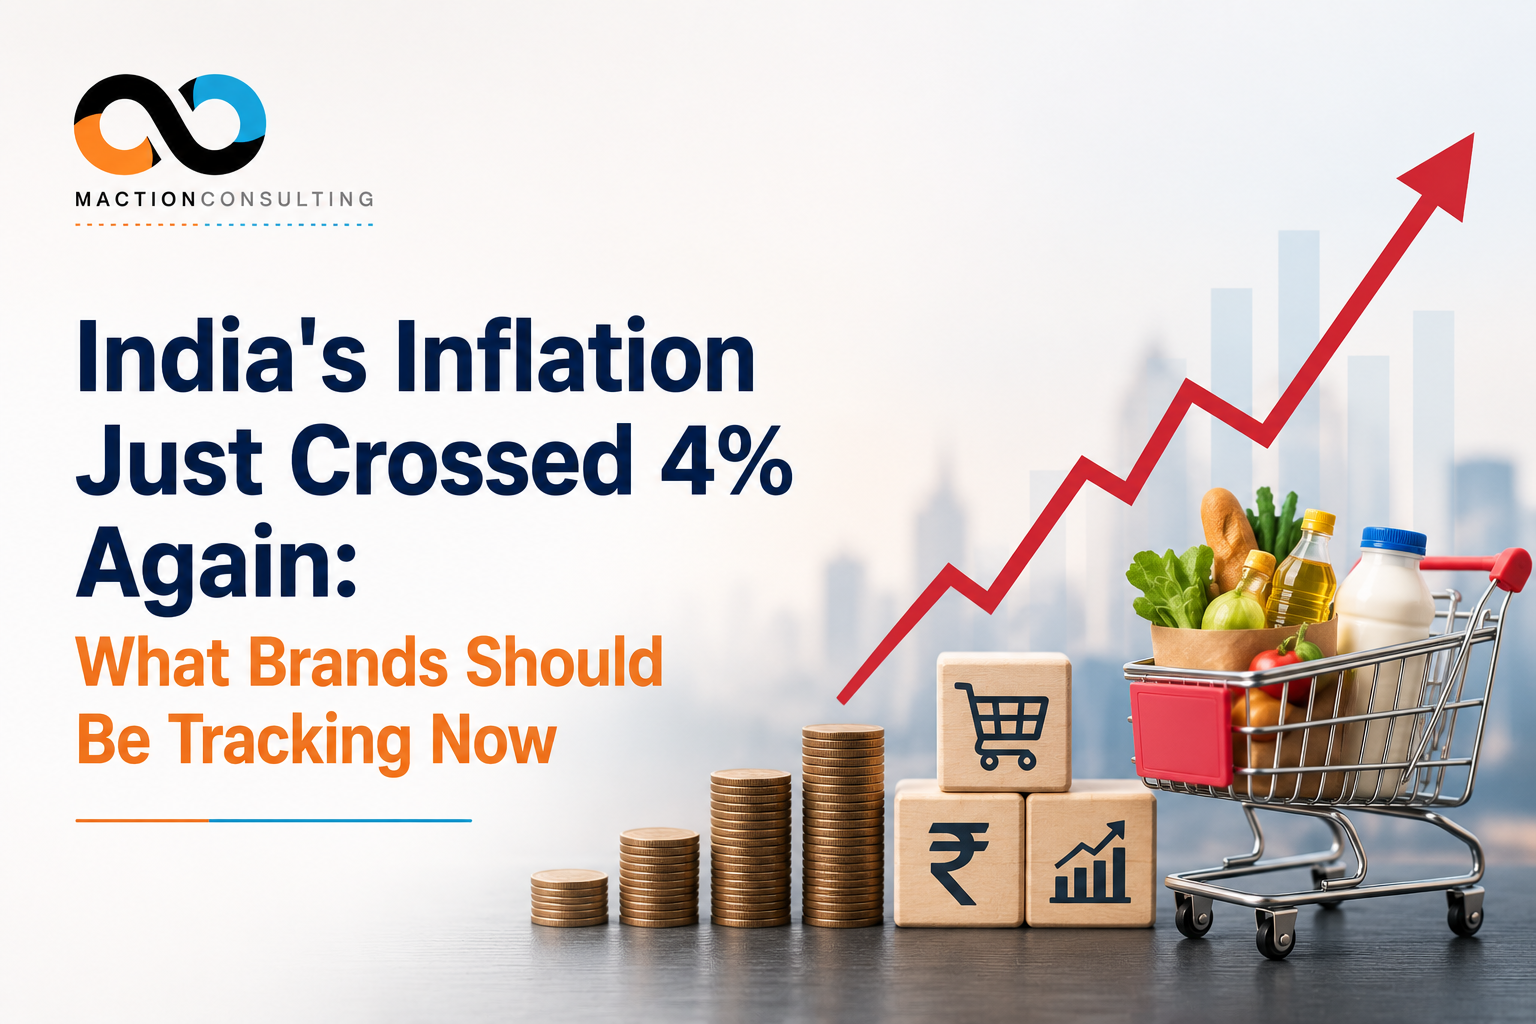

India’s retail inflation crossed 4% in June for the first time in 16 months, coming in at 4.38% against economist expectations of roughly 4.3%. That single data point matters less than the trajectory behind it: inflation has now accelerated for two straight months, from 3.93% in May, and most forecasters see it climbing further, with several projecting a move past 5% by August-September and closer to 6% by year-end. The proximate cause isn’t a mystery — food inflation, fuel costs, and the continuing fallout from the Strait of Hormuz disruption are showing up together in the same print, and that combination changes what brands should be measuring for the rest of 2026.
Why This Inflation Print Is Different From the Last One
India spent much of early 2026 in an unusually comfortable inflation position — readings as low as 1.3% in December and a stretch of months well below the RBI’s tolerance band, prompting talk of a genuine “Goldilocks” economy. That backdrop has shifted meaningfully since airstrikes on Iran in late February triggered a closure of the Strait of Hormuz, the chokepoint carrying roughly a fifth of the world’s seaborne crude oil and a comparable share of global LNG. India imports the large majority of its crude and a significant share of its LPG through routes that pass Hormuz, which is why a geopolitical event on the other side of the Arabian Sea is now visible in a Delhi household’s grocery and fuel bill.
June’s CPI print was the first full month after petrol and diesel price hikes, and economists are explicit that the pass-through isn’t finished: higher fuel costs are still working their way into transport, restaurants, and other non-food categories even as food inflation runs its own course. That’s a structurally different inflation episode than a normal seasonal food-price spike — it’s slower-moving, broader-based, and tied to a geopolitical situation with no clear resolution timeline.
The Consumer Research Blind Spot This Creates
Most brand and category trackers are built around a fairly stable inflation environment, with price-sensitivity questions calibrated to normal, gradual cost changes. A rapid, broad-based inflation acceleration — driven by an external shock rather than a domestic demand cycle — tends to break those calibrations in three specific ways worth watching for in research design right now:
- Trading-down behaviour moves faster than trackers can catch it. When fuel and food costs rise together, households don’t wait for a full quarter’s tracker wave to start switching pack sizes, private label, or purchase frequency. Fieldwork cadence that made sense in a low-inflation year may now be too slow to catch the shift while it’s happening.
- Price perception decouples from actual price change. In a fast-moving inflation environment, consumers often over- or under-estimate how much a specific category has actually moved, anchoring instead on the most visible price change they’ve seen recently (typically fuel). Category trackers that don’t separately probe perceived versus actual price change risk misreading which categories are genuinely under pressure.
- Discretionary categories absorb the squeeze first, and unevenly. A geopolitically-driven fuel and food shock compresses discretionary spend before it shows up in essentials data. Categories like consumer durables, dining out, and travel are typically the earliest and clearest indicators of household belt-tightening — well before a topline CPI number confirms it.
The Monsoon Complicates the Read Further
The Hormuz disruption isn’t the only factor at play. Analysts have also flagged a below-normal monsoon and emerging El Niño conditions as contributors to the June and projected July inflation prints, particularly on the food side. That matters for research design because it means the current inflation episode has two distinct drivers running simultaneously — one geopolitical and fuel-led, one weather-led and food-specific — and they won’t necessarily move together or resolve on the same timeline. A tracker that treats “inflation” as a single undifferentiated pressure will struggle to tell a brand whether a category slowdown is fuel-driven, food-driven, or both, which matters enormously for what corrective action actually helps.
What to Watch and Measure Through Q3
- The RBI’s August policy decision. Most economists expect the Monetary Policy Committee to hold rates steady in August despite the inflation uptick, but a further acceleration toward 5% could shift that calculus — a rate move would itself become a fresh input into consumer sentiment worth tracking.
- Category-specific pass-through, not just the headline number. Transport, food, and restaurant categories are already showing pressure in the data; tracking studies should isolate these rather than relying on a single blended inflation-perception question.
- Urban–rural divergence. Fuel and food price shocks tend to hit rural households harder as a share of budget, even when urban households are more exposed to the initial fuel price signal — worth splitting in any tracker that covers both.
- Early trade-down signals in your own category, particularly in packaged goods and durables, where a shift can show up in sales-mix data weeks before it appears in a quarterly brand tracker.
Frequently Asked Questions
Q: Why did India’s inflation cross 4% in June 2026?
Three factors converged: the Strait of Hormuz disruption following airstrikes on Iran in late February raised fuel and LNG import costs; petrol and diesel retail price hikes passed through in June; and a below-normal monsoon added food inflation pressure simultaneously. Most forecasters see inflation continuing toward 5–6% by year-end.
Q: How does the Strait of Hormuz disruption affect Indian consumers?
India imports the large majority of its crude oil through routes passing the Strait of Hormuz. A disruption raises fuel import costs, which flow through to petrol, diesel, transport, restaurant prices, and eventually most consumer goods categories. The pass-through is gradual but broad-based.
Q: What should brand trackers measure differently during an inflation spike?
Three adjustments matter most: increase fieldwork cadence to catch trading-down behaviour as it happens; separately probe perceived versus actual price change by category; and isolate discretionary category spend as the earliest indicator of household belt-tightening.
Q: How does the monsoon affect India’s inflation in 2026?
A below-normal monsoon is contributing to food inflation separately from the fuel-driven pressure. The two drivers won’t resolve on the same timeline — trackers treating inflation as a single undifferentiated pressure will struggle to separate which driver is affecting their specific category.
The Bigger Point for Research Planning
India went from one of the most benign inflation environments in years to a live, externally-driven inflation episode within a matter of months — and the driver (a Middle East conflict affecting a shipping chokepoint) is not something that resolves on a predictable domestic policy timeline. For brands, that argues for shortening research cycles rather than waiting for the next scheduled tracker wave, and for building inflation-specific diagnostic questions into fieldwork now rather than retrofitting them once the picture is already six months old.
If you need a faster-turnaround pulse check on how inflation is affecting your category’s consumer behaviour, talk to our research team at Maction.


3 thoughts on “India’s Inflation Just Crossed 4% Again: What Brands Should Be Tracking Now”