
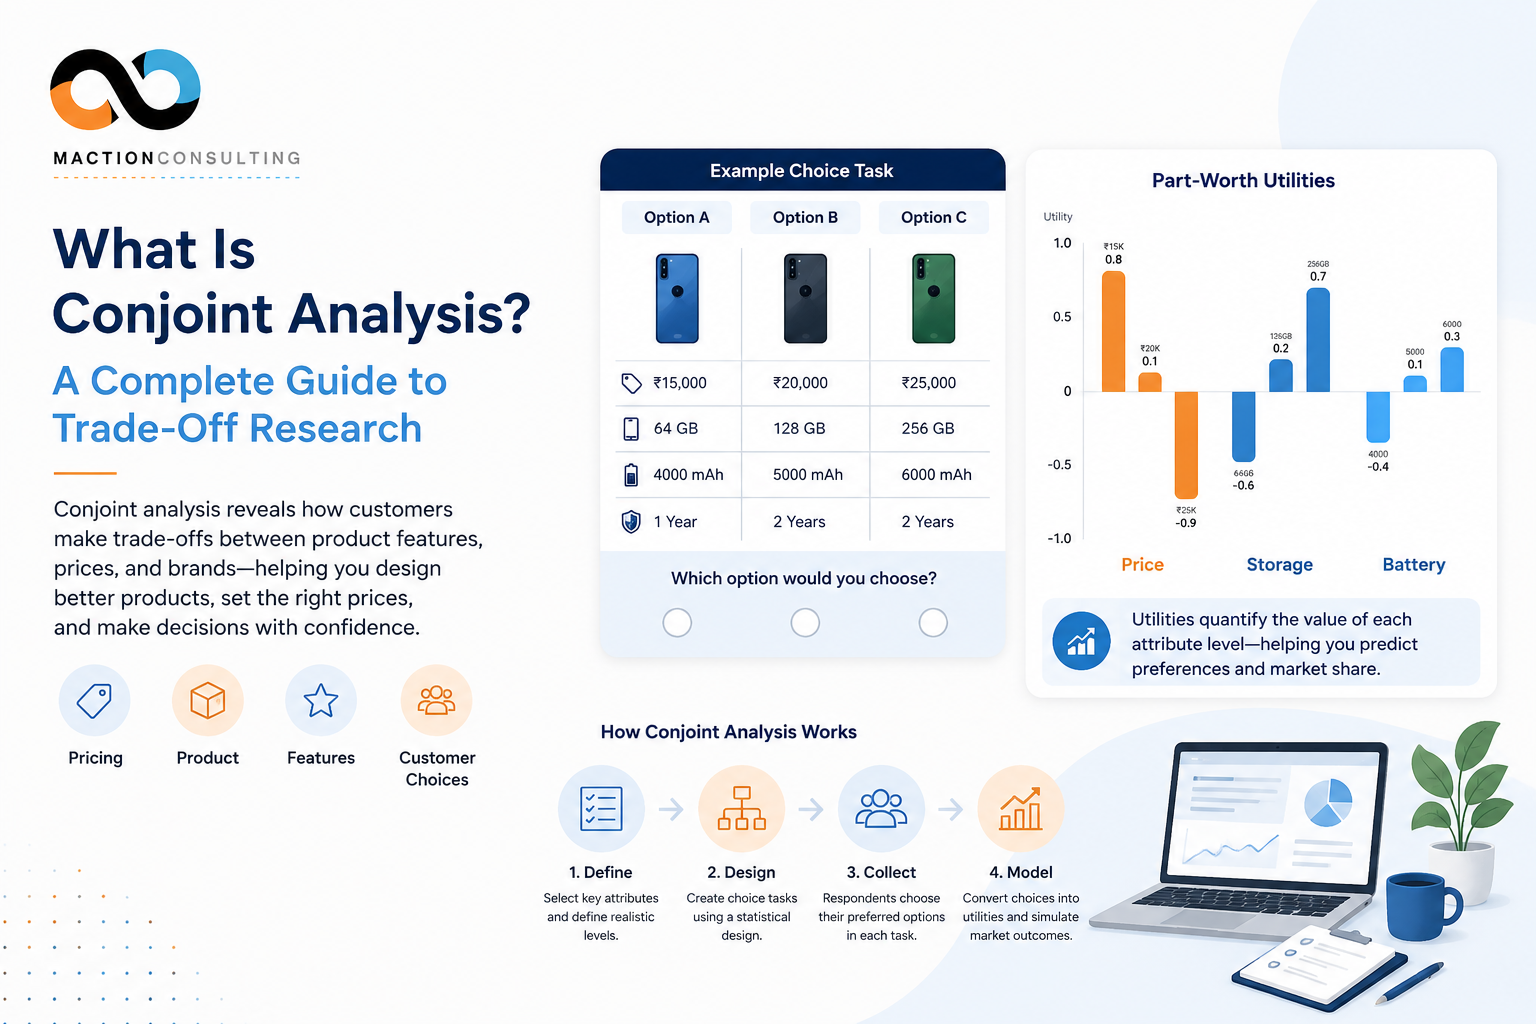

Conjoint analysis is a market research technique that reveals how customers make trade-offs between competing product features, prices, and brands — by asking them to choose between realistic product bundles rather than rate features in isolation. It’s one of the most reliable ways to answer questions like “how much would customers pay for this feature?” or “which combination of attributes actually drives a purchase decision?” If you’ve ever wondered why a straightforward “how important is price to you?” survey question tends to produce misleading answers — nearly everyone says price matters most — conjoint analysis exists to solve exactly that problem.
What Is Conjoint Analysis, in Plain Terms?
Conjoint analysis presents respondents with several versions of a product, each built from different combinations of attributes — say, brand, price, screen size, and battery life for a smartphone — and asks them to choose which version they’d buy, or to rank a small set of options. Because respondents are choosing between realistic trade-offs rather than rating each attribute independently, the technique captures how people actually weigh features against each other, the same way they do when standing in front of a shelf or a checkout page.
The output is a set of “part-worth utilities” — a numerical value showing exactly how much each attribute level contributes to a customer’s decision to choose one option over another. From these utilities, researchers can simulate market share for any hypothetical product configuration, calculate willingness-to-pay for a specific feature, and identify the exact combination of attributes that maximises preference within a given cost constraint.
How Does Conjoint Analysis Work?
A typical conjoint study follows four steps:
- Define the attributes and levels: Choose the 4-6 product attributes that matter most (e.g., brand, price, capacity, warranty) and 2-4 realistic levels for each (e.g., price at ₹15,000 / ₹20,000 / ₹25,000).
- Generate choice tasks: A statistical design creates a set of product profiles — combinations of attribute levels — structured so that every attribute’s effect can be isolated once responses are analysed.
- Field the survey: Respondents see a series of these profiles (typically 8-15 choice tasks) and pick their preferred option in each, mimicking a real shopping decision.
- Model the results: This is where data analytics capability matters most — the modelling step converts raw choices into decision-ready outputs. Statistical modelling (typically hierarchical Bayesian estimation for choice-based conjoint) converts the raw choices into part-worth utilities for each attribute level, which can then be used to simulate preference share for any product configuration, real or hypothetical.
Types of Conjoint Analysis
- Choice-Based Conjoint (CBC). The most widely used approach today. Respondents pick their preferred option from a small set of complete product profiles, closely mirroring a real purchase decision. Works well for most commercial applications, including pricing and feature-prioritisation studies.
- Adaptive Conjoint Analysis (ACA). The survey adapts in real time based on each respondent’s previous answers, narrowing in on the attributes that matter most to them. Useful when there are many attributes to test and survey length needs to stay manageable.
- Traditional (Full-Profile) Conjoint. Respondents rate or rank complete product profiles rather than choosing between them. Less common now, but still used for smaller attribute sets or specific analytical needs.
- Menu-Based Conjoint (MBC). Simulates a menu-style buying process where respondents build their own product by selecting individual features and add-ons — useful for categories like insurance, telecom plans, or software subscriptions.
When Should You Use Conjoint Analysis?
Conjoint analysis is the right tool when a decision genuinely involves trade-offs between multiple product or service attributes — not every research question needs it. It tends to deliver the most value in situations like:
- Pricing decisions — understanding what customers will actually pay for a product, a specific feature, or an upgrade, rather than relying on stated price sensitivity, which respondents routinely misreport.
- Product and feature prioritisation — deciding which features to include in a next-generation product when budget or engineering capacity can’t support all of them.
- New product design — testing multiple potential product configurations before committing to manufacturing or development costs.
- Positioning against competitors — simulating how a proposed product would perform in preference share against named competitor products already in the market.
- Bundling and packaging decisions — for telecom, insurance, SaaS, and subscription businesses deciding which features belong in which pricing tier.
Conjoint Analysis vs. Other Research Techniques
Conjoint analysis is often confused with, or considered alongside, a few related techniques. The distinctions matter for choosing the right tool:
- Conjoint analysis vs. MaxDiff. MaxDiff (Maximum Difference Scaling) asks respondents to pick the most and least important item from a list, and is best suited to ranking a large list of individual items (features, brand attributes, messaging claims) by relative importance. Conjoint analysis is better suited when you need to understand trade-offs between combined attributes — including price — rather than rank a single list.
- Conjoint analysis vs. simple rating scales. Asking respondents to rate the importance of price, quality, and features separately on a 1-10 scale is faster to field but far less reliable — most respondents rate everything as important, and stated importance rarely predicts actual purchase behaviour. Conjoint analysis avoids this by forcing real trade-offs.
- Conjoint analysis vs. Van Westendorp pricing. Van Westendorp’s Price Sensitivity Meter is a simpler, faster method for finding an acceptable price range for a single product, but it doesn’t account for how price interacts with other features. Conjoint analysis is the better choice when pricing needs to be tested alongside product configuration, not in isolation.
Common Mistakes to Avoid in Conjoint Analysis
- Including too many attributes. More than 6-7 attributes makes choice tasks cognitively overwhelming for respondents and degrades data quality. Prioritise the attributes that genuinely drive the decision.
- Using unrealistic attribute combinations. A statistical design that generates implausible product profiles (e.g., a budget phone with flagship specs at a rock-bottom price) produces choices that don’t reflect real-world decision-making.
- Undersizing the sample for subgroup analysis. If the study needs to report preference differences across segments — age groups, cities, income tiers — each subgroup needs its own adequately sized base, the same principle that applies to any survey sample size calculation.
- Treating the output as a forecast rather than a preference model. Conjoint analysis predicts relative preference under the tested conditions; it doesn’t account for distribution, awareness, or competitive response, and shouldn’t be presented to stakeholders as a guaranteed sales forecast.
Frequently Asked Questions
How many respondents do I need for a conjoint study?
Most choice-based conjoint studies work well with 200-400 respondents at the total sample level, though the right number depends on how many subgroups need independent analysis — the same logic covered in our guide to survey sample size.
How long does a conjoint analysis study take?
A typical study, from attribute definition through fielding and analysis, takes roughly 4-6 weeks, depending on sample complexity and how many markets or segments are involved.
Can conjoint analysis be used for services, not just physical products?
Yes — conjoint analysis works equally well for services, subscriptions, insurance plans, and B2B offerings, anywhere a customer is choosing between a bundle of attributes, including intangible ones like warranty length or support tier.
Is conjoint analysis expensive compared to a standard survey?
It typically costs more than a simple rating-scale survey due to the more complex design and analysis, but it’s considerably cheaper than making a pricing or feature decision based on unreliable stated-importance data and getting it wrong.
Getting Started with Conjoint Analysis
Conjoint analysis is one of the more technically demanding tools in a researcher’s toolkit, but it consistently produces the kind of decision-ready output — willingness-to-pay figures, feature-priority rankings, market simulations — that stated-preference surveys simply can’t match. The key to getting reliable results is getting the attribute list, levels, and study design right before fielding begins, since errors at the design stage are difficult to correct after the data is collected.
If you’re planning a pricing, product design, or feature-prioritisation study and want to know whether conjoint analysis is the right approach, talk to our research team at Maction.