

When FADA’s August data showed CNG, hybrid, and electric cars edging past petrol for the first time, we flagged that a single month wasn’t a trend and that September and October would be the more reliable read. September’s numbers are now out, and they answer the question in a more interesting way than either “the shift is real” or “it was a blip.” Petrol and ethanol cars took 41.27% of passenger vehicle retail, against 41.00% for all alternative fuels combined. FADA’s own framing is that August was an inflection rather than a decisive flip, and that the two are now effectively at parity, trading the lead from month to month.
Two Different Things Happened Inside “Alternative Fuels”
| Share of PV retail | August 2026 |
September 2026 |
|
Petrol / ethanol |
40.85% |
41.27% |
| CNG / LPG | 25.28% |
23.11% |
|
Hybrid |
9.04% | 9.44% |
| Electric | 7.63% |
8.45% |
| All alternative fuels combined | 41.95% |
41.00% |
The combined alternative-fuel share barely moved, but its components moved in opposite directions. CNG and LPG fell by more than two points, from 25.28% to 23.11%. Electric rose to a fresh high of 8.45%, up from 5.74% in September last year, and electric passenger vehicle retail nearly doubled year on year to 36,108 units. Hybrids edged up as well. Looked at as a single “alternative fuel” bucket, September looks like a pause. Looked at by powertrain, it looks like a handover, with electric gaining as CNG gave ground.
What This Does to the Running-Cost Hypothesis
In the August piece, we suggested the crossover was led by CNG rather than EVs, and that running-cost economics were a plausible driver, a hypothesis we described as testable rather than confirmed. September gives it a mixed result. CNG’s share fell in a month when crude was climbing toward $107, which is not what a purely fuel-cost story would predict. But FADA also cited supply shortfalls in fast-moving models in its September commentary, so a drop in share could reflect what dealers could deliver rather than what buyers wanted. One month can’t separate those two explanations. What it does show is that the August shift was not a one-way move, and that treating “alternative fuel” as a single consumer motivation would have been a mistake.
Read the Record Headline Against Its Base
September was the best-ever September for Indian auto retail: 25.37 lakh units, up 31.82% year on year, with passenger vehicles up 32.10% to about 4.27 lakh. FADA itself cautions that this needs to be read against a distorted base, since purchases were deferred in September 2025 ahead of the GST 2.0 rate changes. A growth rate measured against an artificially weak month overstates underlying momentum, and any category tracker that quotes the 32% without that caveat is quoting a number the industry body itself qualifies.
Two other details are worth noting. Urban passenger vehicle retail grew 32.11% and rural grew 32.09%, almost identical, which is a useful reminder that not every category splits along the rural-urban lines we’ve seen in food inflation or retail recovery. And FADA reported Shraadh-related deferment in the closing week of the month, which means part of the festive demand that dealers expect is still ahead, not already in the number.
Intent Surveys and Registrations Measure Different Things
Deloitte’s March consumer tracking, which we covered in the “calibrated consumption” post, showed vehicle purchase intent down 12 points year on year, with many consumers saying their current vehicle still met their needs. Six months later, registrations set a record. These aren’t contradictory: intent and registrations are different measures, and September’s registrations are flattered by the base effect above. But the gap is a good example of why a single indicator, whether a survey or a sales figure, shouldn’t be read as a stand-in for the other.
What to Track Through the Festive Window
- Separate supply-constrained months from demand-constrained ones. Dealer inventory and waiting periods for specific models will tell you whether a share shift reflects buyer preference or what was available to sell.
- Track electric and CNG buyers as separate segments. The September split suggests they respond to different things, and combining them hides the pattern.
- Use base-adjusted comparisons. Compare against two years ago, not just last year, for any month touched by the GST 2.0 deferral.
- Pair registration data with stated intent, and treat divergence between them as a finding to explain, not an error to resolve.
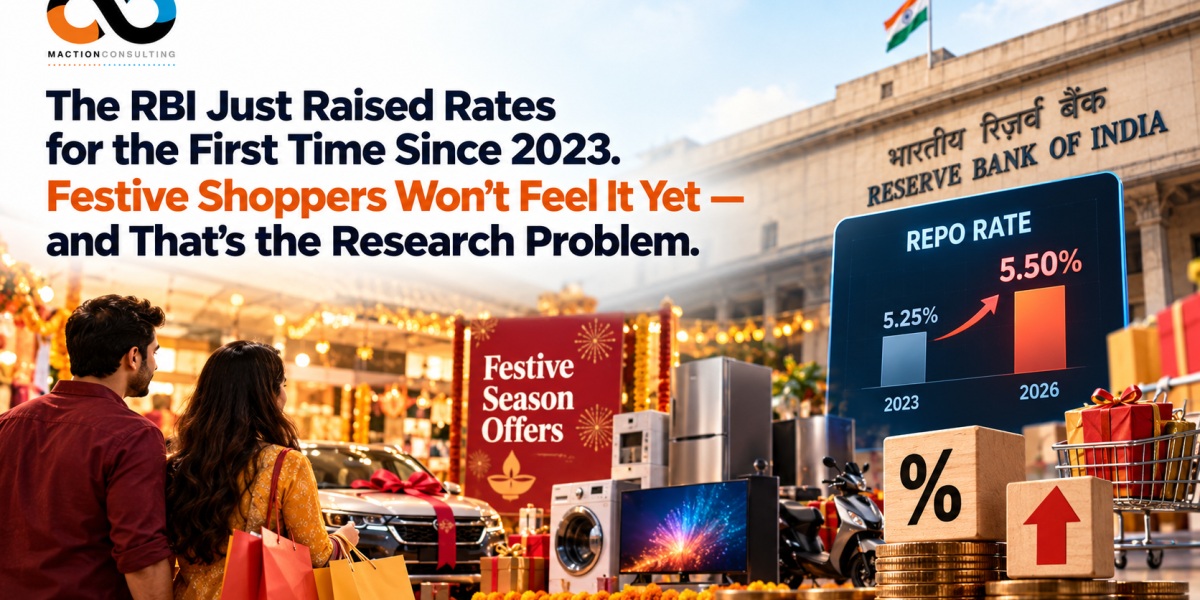
- Test financing sensitivity directly. With the RBI having raised rates on October 7 and further hikes possible, vehicles are one of the categories where borrowing cost may influence timing. Ask buyers rather than assuming.
- Watch October’s release. FADA publishes monthly data in the first week of the following month, and October’s numbers will be the first to include Navratri and Dussehra and the first after the rate hike, while Dhanteras and Diwali fall in November’s data.
Frequently Asked Questions
Did alternative fuels overtake petrol cars in India?
In August 2026, CNG, hybrid and electric cars combined edged past petrol for the first time, at 41.95% vs 40.85% of passenger vehicle retail. In September, petrol and ethanol regained a narrow lead at 41.27% vs 41.00%. FADA describes the two as effectively at parity.
What happened to CNG and EV sales in September 2026?
CNG and LPG share fell from 25.28% to 23.11%, while electric rose to a record 8.45%. Electric passenger vehicle retail nearly doubled year on year to 36,108 units, and hybrids edged up to 9.44%.
Why did CNG’s share fall when crude oil prices were rising?
It’s unclear. A fuel-cost story would predict the opposite, but FADA also cited supply shortfalls in fast-moving models, so the drop may reflect what dealers could deliver rather than buyer preference. One month of data can’t separate the two.
Is the 32% growth in September 2026 car sales reliable?
Treat it with caution. FADA notes that September 2025 was a weak base because buyers deferred purchases ahead of the GST 2.0 changes, so year-on-year growth overstates underlying momentum. Comparing against two years ago gives a clearer picture.
When will FADA release October 2026 data?
FADA typically publishes monthly retail data in the first week of the following month. October’s release will be the first to cover Navratri and Dussehra and the first after the RBI’s October 7 rate hike.
The Bigger Point
A crossover that partially reverses the following month is less dramatic than the original headline, but it’s more informative. It shows the underlying market is a contest between powertrains with different buyers and different motivations, not a single migration away from petrol. For auto brands and anyone researching mobility, the question to answer before the festive season peaks is no longer whether alternative fuels are growing, but which kind, for whom, and whether the answer holds when supply and base effects are stripped out.
If you want to understand what is driving powertrain choice among your buyers, talk to our research team at Maction.