
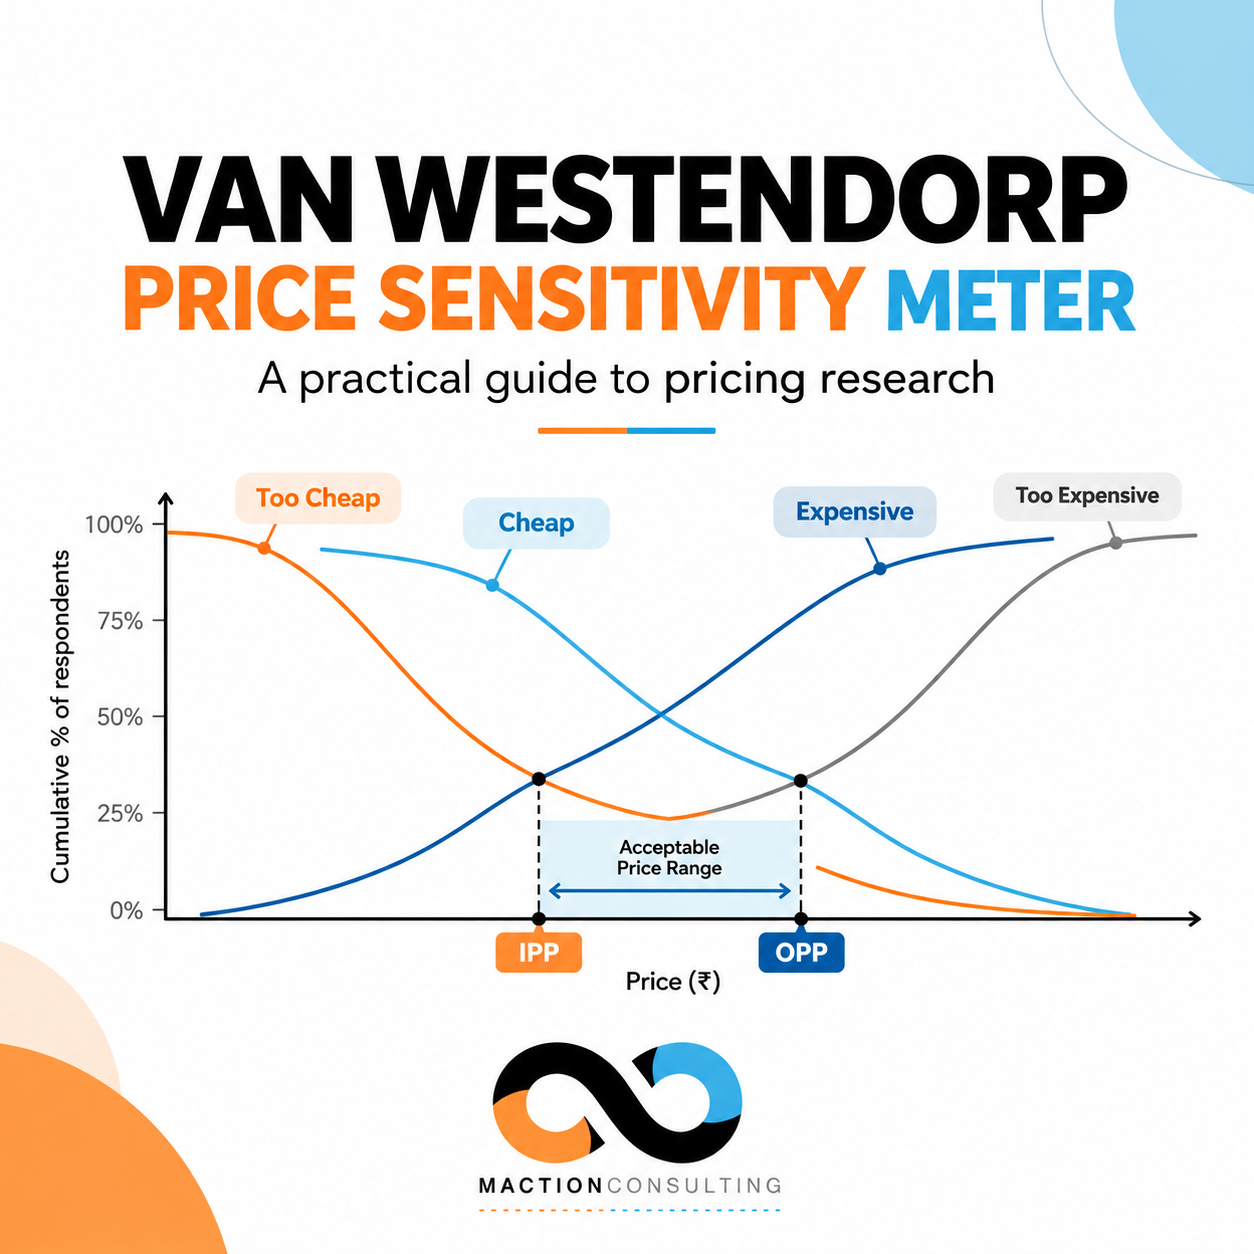

The Van Westendorp Price Sensitivity Meter (PSM) is a survey method that finds the price range customers will accept for a product by asking four simple questions about when a price feels too cheap, a bargain, expensive, or too expensive. Plotting the answers produces an acceptable price range and two reference prices, the optimal price point and the indifference price point. It’s one of the fastest ways to put evidence behind a launch price, and because it doesn’t need a predefined list of prices to test, it’s often the first pricing tool teams reach for. It also has real limits, which this guide covers alongside how to run and read it.
What Is the Van Westendorp Price Sensitivity Meter?
The method was introduced in 1976 by Dutch economist Peter van Westendorp and presented at the ESOMAR Congress. Instead of asking respondents to name a single price they would pay, which tends to produce unreliable answers, it asks them to mark the edges of their own comfort zone. Each respondent gives four prices. Across a sample, those answers form four cumulative curves, and the places where the curves cross are the outputs.
Because the questions are open-ended and the analysis is done after fielding, the method works well before a product’s price has been decided, and it can run before the product concept is fully locked.
The Four Van Westendorp Questions
Each respondent is shown the same product description and asked four questions, usually in a fixed order:
- Too expensive: At what price would the product be so expensive that you would not consider buying it?
- Expensive (getting expensive): At what price would it start to feel expensive, so that you would still consider it but would have to think about it?
- Cheap (a bargain): At what price would you consider it a bargain, a great buy for the money?
- Too cheap: At what price would it be so cheap that you would doubt its quality?
Answers are entered as numbers rather than picked from a list, which is what lets the analysis find the thresholds without the researcher guessing them in advance.
How to Read the Four Price Points
Plot price on the horizontal axis and cumulative percentage of respondents on the vertical axis. The standard method inverts two of the four curves so that they can intersect. The crossings give the key reference points:
|
Price point |
Where the curves meet |
What it tells you |
| OPP (Optimal Price Point) | “Too cheap” meets “too expensive” | The price where resistance at both extremes is balanced |
| IPP (Indifference Price Point) | “Cheap” meets “expensive” | The price where equal shares of respondents call it cheap and expensive |
| PMC (Point of Marginal Cheapness) | Varies by convention (see note below) | Lower bound of the acceptable range; below it, price starts to raise quality doubts |
| PME (Point of Marginal Expensiveness) | Varies by convention (see note below) | Upper bound of the acceptable range; above it, too many buyers drop out on price |
The span from PMC to PME is the range of acceptable prices, sometimes called the RAP. Practitioners agree on how to read the OPP and the IPP, but the exact curve pairs used to define the PMC and PME vary slightly between sources, so whichever convention you use, state it in your report and apply it consistently.
A Worked Example (Illustrative)
The numbers below are hypothetical and are used only to show how the output is read. They are not results from a real study.
|
Price point (hypothetical) |
Result for a 500 ml cold-pressed juice |
|
PMC |
Rs 90 |
|
OPP |
Rs 115 |
|
IPP |
Rs 120 |
| PME |
Rs 150 |
| Acceptable range (PMC to PME) |
Rs 90 to Rs 150 |
In this example, buyers start to doubt the quality of a 500 ml cold-pressed juice below Rs 90 and begin to drop out above Rs 150. A brand positioned as a premium product would price toward the upper end of that range. A brand competing for volume would price nearer the OPP and IPP, around Rs 115 to Rs 120. The width of the range is informative too: a wide range suggests a market tolerant of different price points, while a narrow one suggests buyers are price-sensitive and any increase carries more risk.
How to Run a Van Westendorp Study, Step by Step
- Describe the product clearly. Respondents can only price what they understand, so the concept description (features, size, format, and the unit being priced, such as per pack or per month) needs to be specific and identical for everyone.
- Recruit the right buyers. Sample the people who would actually buy the product, not a general population, and keep segments you want to compare as separate groups.
- Ask the four questions in a fixed order, with numeric open-ended answers.
- Clean the data. Review respondents whose answers are illogical, for example a “too cheap” price higher than their “too expensive” price, and decide on a consistent rule for handling them.
- Plot the cumulative curves and read the intersections, then report the acceptable range, the OPP, and the IPP.
- Read it by segment. A single blended curve can hide the fact that different groups have different acceptable ranges.
The curves get smoother and the intersections more stable as the sample grows, and each segment you want to read separately needs its own adequate base, the same principle covered in our guide to survey sample size.
When to Use It, and When Not To
The Van Westendorp method fits best at the early stages of pricing, when you need a defensible range quickly, don’t yet have a price ladder to test, and want a simple output stakeholders can follow. It also has limits worth stating plainly:
- It gives a range, not a single profit-maximising price. It maps perception, not demand or margin.
- It measures stated opinion, which can differ from what people actually pay.
- It has no competitive context unless you build it into the product description or run it alongside other methods.
- It assumes respondents understand the product. If they are pricing something different from what you intend, the range will be off.
- It has been critiqued methodologically in the academic literature, including work by Lipovetsky and colleagues, which is one reason many teams treat it as a starting point rather than the final word.
Van Westendorp vs. Conjoint Analysis vs. Gabor-Granger
- Van Westendorp maps an acceptable price range from four threshold questions and collects no purchase-intent ratings. It’s fast and light.
- Gabor-Granger asks how likely a respondent is to buy at a series of preset prices, which lets you build a demand curve for a single product.
- Conjoint analysis tests price alongside other attributes, so it’s the better choice when price has to be set together with product configuration. See our guide to conjoint analysis for when that applies.
A common sequence is to use Van Westendorp early to bound the range, then a more structured method to refine the decision inside it.
Common Mistakes to Avoid
- Vague product descriptions, which produce a range for a product that exists only in each respondent’s imagination.
- Mixing very different segments into a single curve, which blurs the thresholds.
- Ignoring the pricing unit. Per pack, per month, and per user are not interchangeable.
- Treating the OPP as the profit-maximising price. It marks where resistance is balanced, not where revenue or margin peaks.
- Over-reading a small sample. Jagged curves produce unstable intersections.
Frequently Asked Questions
What is the Van Westendorp Price Sensitivity Meter?
It is a survey-based pricing method that uses four questions to identify an acceptable price range and reference prices for a product or service.
What are the four Van Westendorp questions?
They ask at what price a product becomes too expensive, starts to feel expensive, feels like a bargain, and is so cheap that quality becomes doubtful.
What does the optimal price point mean?
The OPP is where the “too cheap” and “too expensive” curves cross, the point at which resistance at the two extremes is balanced. It is not necessarily the price that maximises profit.
How many respondents do I need?
There is no single number. Larger samples give smoother curves and more stable intersections, and each segment you want to analyse separately needs its own adequate base.
Can it be used for services and subscriptions?
Yes, as long as the unit being priced is clearly defined, for example per month or per user, and respondents understand what the service includes.
How is it different from conjoint analysis?
Van Westendorp looks at price perception on its own and is quick to run. Conjoint analysis tests price together with other product attributes and is better suited to decisions that involve trade-offs between them.
Getting Started
The Van Westendorp Price Sensitivity Meter is a practical way to move from “what should we charge?” to a defensible range backed by buyer perception. Its value depends on the details: a clear product description, the right sample, clean data, and an honest reading of what a range can and can’t tell you about the final price.
If you’re planning a pricing study and want to know whether Van Westendorp, Gabor-Granger, or conjoint analysis fits your decision, talk to our research team at Maction.