
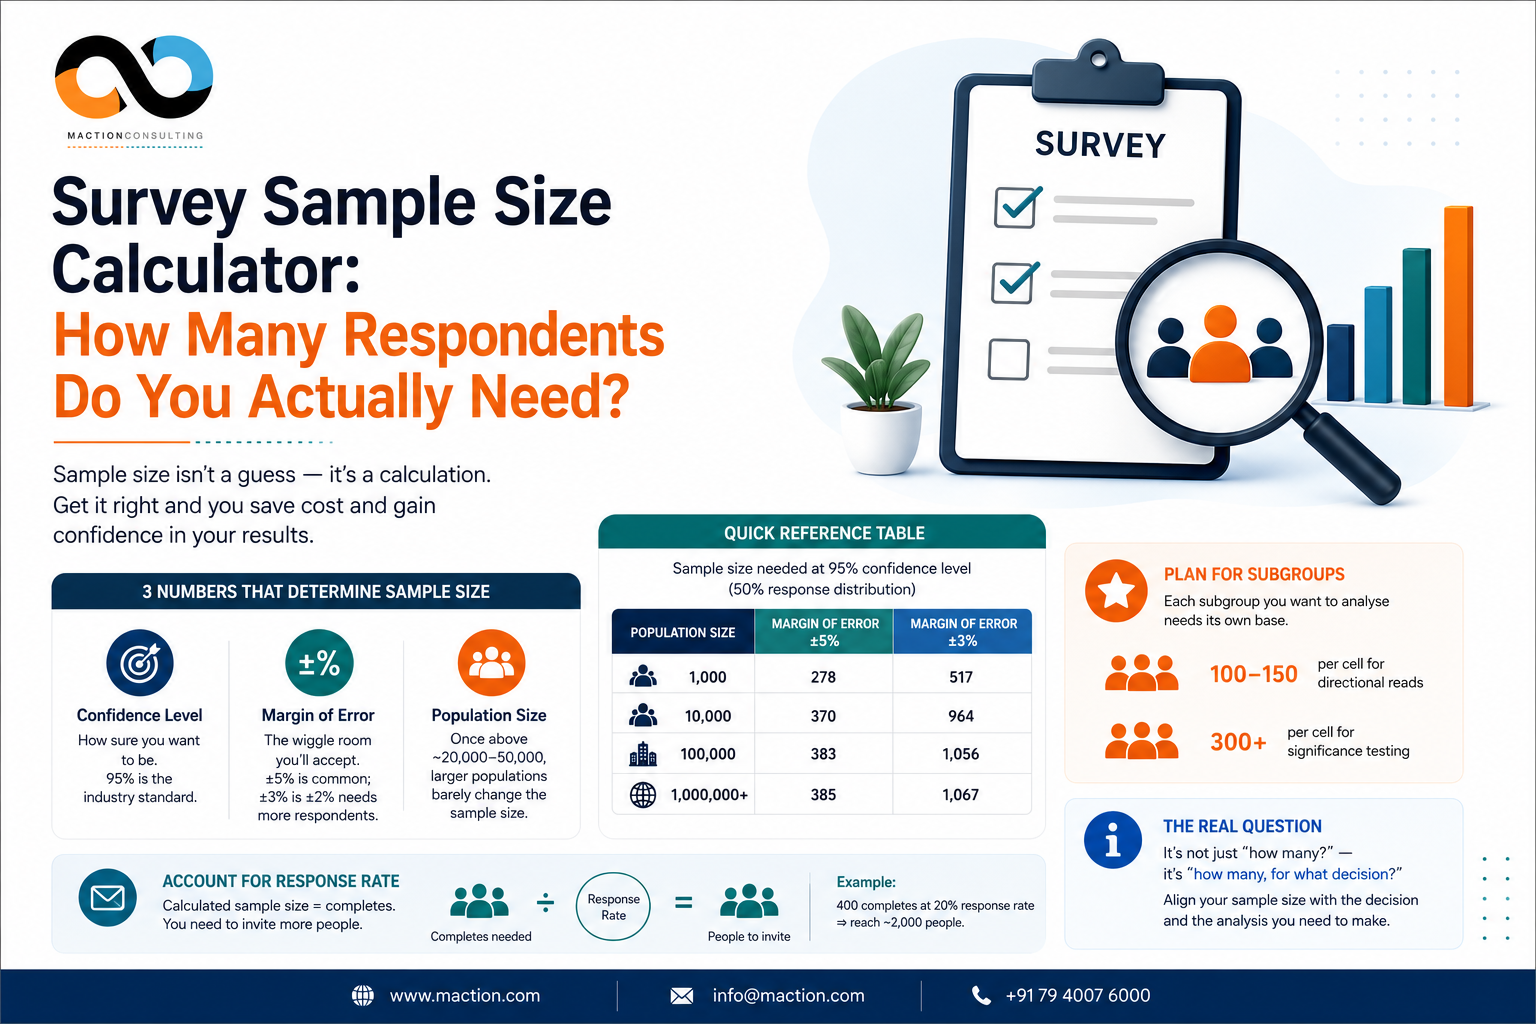

It’s one of the first questions every client asks when scoping a research project, and one of the most misunderstood: “How many people do w.e need to survey?” The instinct is often to think bigger is always better, or conversely, to default to a round number like 500 or 1,000 because it feels safe. Neither approach is right. Sample size isn’t a guess — it’s a calculation, and getting it wrong in either direction costs you either money or confidence in your results.
The Three Numbers That Actually Determine Sample Size
Every sample size calculation comes down to three inputs. Get clarity on these first, and the rest is arithmetic.
- Confidence level — how sure you want to be that your sample reflects the true population. 95% is the industry standard; 99% is used for high-stakes decisions like regulatory or clinical research.
- Margin of error (confidence interval) — how much wiggle room you’re willing to accept. A ±5% margin means if 60% of respondents prefer your product, the true figure across the population likely falls between 55% and 65%. Tighter margins (±3% or ±2%) require dramatically larger samples.
- Population size — the total group you’re trying to represent. Interestingly, once your population crosses roughly 20,000–50,000, further increases barely move the required sample size at all — a survey representing a city of 200,000 and one representing a country of 200 million need almost the same number of respondents.
There’s a fourth input that’s easy to forget: expected response distribution, usually set at 50% as a conservative default because it produces the largest — and therefore safest — required sample size.
A Quick Reference Table
Assuming a 95% confidence level and 50% response distribution, here’s how sample size requirements shift with population and margin of error:
| Population Size | Sample Size (95% CI, ±5%) | Sample Size (95% CI, ±3%) |
| 1,000 | 278 | 517 |
| 10,000 | 370 | 964 |
| 100,000 | 383 | 1,056 |
| 1,000,000+ | 385 | 1,067 |
Why Your Sample Size Often Needs to Be Bigger Than the Table Says
The numbers above tell you the minimum for reporting on your total sample. But most research isn’t just about the topline number — it’s about comparing subgroups: urban vs. rural, age bands, income tiers, users vs. non-users of a competitor product. Each subgroup you want to analyse independently needs its own statistically sound base, typically a minimum of 100–150 respondents per cell for directional reads, and 300+ if you plan to run significance testing between groups.
This is where sample size calculations most often go wrong in practice. A brand might commission 1,000 interviews nationally, which sounds robust — until you realise the plan calls for breakouts across 6 cities, 3 age groups, and 2 usage segments. Divided that finely, some cells end up with 20–30 respondents, well below the threshold needed to say anything statistically meaningful. The fix isn’t always a bigger overall sample; sometimes it’s a smarter stratified sampling design that guarantees minimum thresholds where you actually need them.
Response Rate: The Number Everyone Forgets to Plan For
A calculated sample size tells you how many completed responses you need — not how many people you need to invite. If your category typically sees a 20% response rate, and you need 400 completes, you need to reach roughly 2,000 eligible people. Response rates vary widely by mode (online panels, CATI, in-person intercepts, B2B decision-maker outreach) and by how well-targeted your recruitment list is. Skipping this step is the single most common reason fieldwork timelines slip.
When the Standard Formula Doesn’t Apply
The confidence-interval formula assumes simple random sampling from a well-defined population — a clean assumption that rarely holds in real fieldwork. A few situations where the standard calculator undersells what you actually need:
- B2B and niche populations. If you’re surveying category decision-makers at mid-size manufacturing firms in Gujarat, your addressable population might be a few thousand people, not millions — and recruitment difficulty, not statistics, becomes the binding constraint.
- Qualitative or exploratory research. Sample size logic here follows saturation, not statistical formulas — typically 8–12 in-depth interviews or 3–4 focus groups per segment, until new interviews stop surfacing new themes.
- Longitudinal or tracking studies. Wave-on-wave attrition means your baseline sample needs a built-in buffer, or later waves will fall below reportable thresholds.
Frequently Asked Questions
Q: What is the standard sample size for a survey in India?
For a nationally representative survey of India with a 95% confidence level and ±5% margin of error, a minimum of 385 respondents is statistically required. However, most research projects need larger samples — typically 500 to 1,500 — to allow for subgroup analysis across regions, demographics, or usage segments.
Q: What confidence level should I use for market research?
95% confidence is the industry standard for most consumer and B2B research. 99% confidence is used for high-stakes decisions such as regulatory submissions or clinical studies, but requires significantly larger samples.
Q: What happens if my survey sample size is too small?
Small samples produce wide margins of error — meaning your findings could differ substantially from the true population figure. More critically, subgroup analyses with fewer than 100 respondents per cell are statistically unreliable and should not be used to make business decisions.
Q: Does a larger population always require a larger sample?
No — one of the counterintuitive facts about sample size is that once a population exceeds roughly 20,000 to 50,000 people, the required sample size barely changes. A survey of a city of 200,000 and a country of 200 million need almost the same number of respondents at equivalent confidence levels.
Q: How do I calculate sample size for subgroup analysis?
Each subgroup you want to analyse independently needs its own statistically sound base — a minimum of 100 to 150 respondents per cell for directional reads, and 300 or more if you plan significance testing between groups. Design your total sample from the subgroup requirements upward, not the other way around.
The Real Question Isn’t “How Many” — It’s “How Many, For What Decision”
Sample size calculators are a useful starting point, but the number that actually matters is the one tied to the decision your research needs to support. A go/no-go launch decision — the kind of decision that consumer product testing is specifically designed to support — a pricing decision, and a broad brand-tracking study all carry different risk tolerances — and therefore justify different sample investments. The most expensive mistake isn’t running a sample that’s slightly too small; it’s collecting a large, expensive sample that still can’t answer the specific question a subgroup breakout or a significance test is being asked to answer.
At Maction, sample design is one of the first things we work through with clients — before fieldwork begins, not after the data comes back short. If you’re scoping a study and want a sample plan built around your actual reporting needs, talk to our research team.




This site completely changed how I enjoy online gambling. The interface is so intuitive that even my parents could figure it out in no time. I really admire their commitment to fair play and responsible gaming guidelines. Every time I log in I feel like I am stepping into a friendly neighborhood casino. mxmexbetcasino