
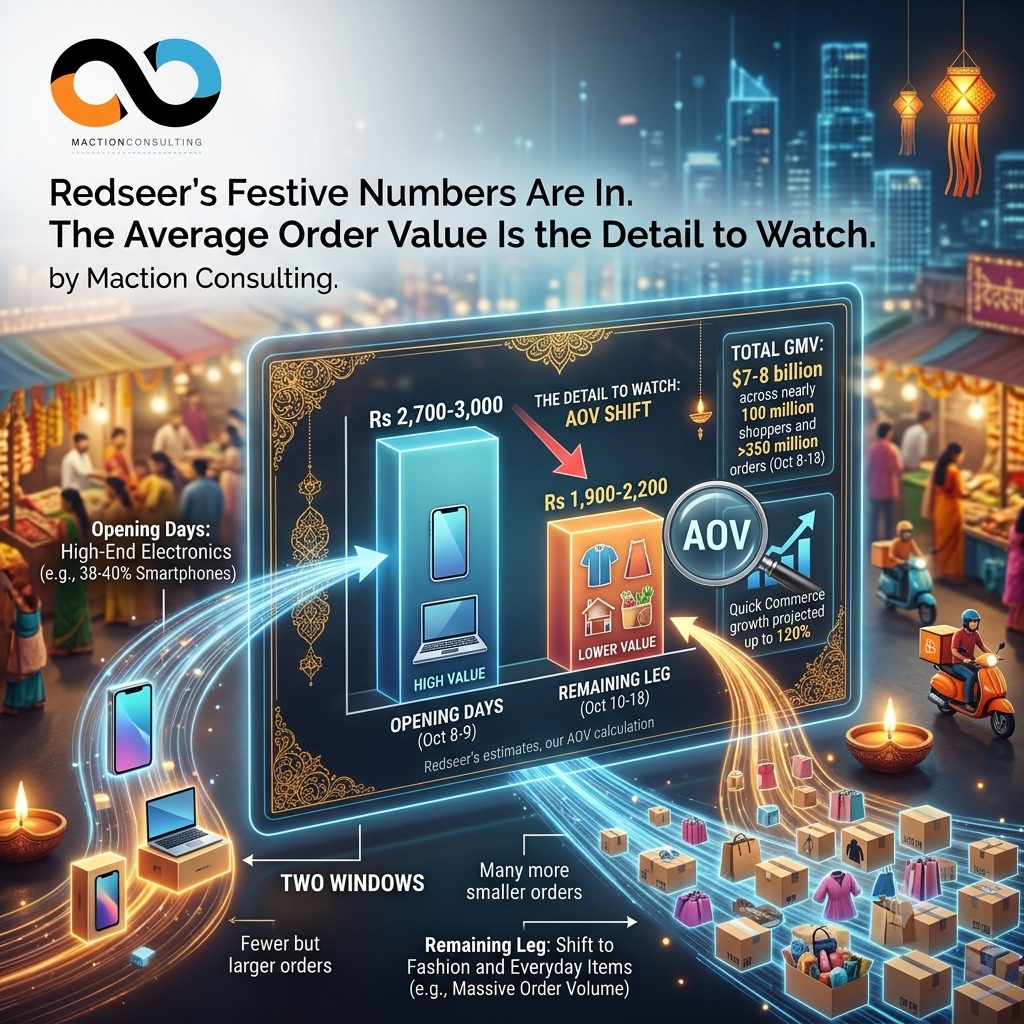

When the festive sales opened on October 8, we wrote that “orders doubled” was only the first number. Redseer Strategy Consultants has now published estimates that let us start answering the questions that post raised: what was bought, by whom, and how the mix changed as the sale went on. The headline is large. Redseer puts GMV for the first two days at more than $2.5 billion, or about Rs 24,200 crore, roughly six times a normal day, and its more recent estimate for the first leg from October 8 to 18 is $7-8 billion across nearly 100 million shoppers and more than 350 million orders. The more interesting finding sits inside those figures.
Two Windows, Two Very Different Order Sizes
| Redseer estimate | October 8-9 |
October 8-18 |
| Gross merchandise value | Over $2.5 billion (about Rs 24,200 crore) | $7-8 billion |
| Orders | 80-90 million | More than 350 million |
| Shoppers | 60-65 million | Nearly 100 million |
| Average value per order (our arithmetic) | About Rs 2,700-3,000 | At most about Rs 1,900-2,200 |
The last row is our own calculation from Redseer’s published ranges, using the exchange rate implied by its own conversion of $2.5 billion to Rs 24,200 crore. Because the first-leg order count is given as “more than” 350 million, the average there is an upper bound. Even allowing for the ranges, the pattern is clear: the average order across the full first leg is meaningfully smaller than the average across the opening two days. Because the first leg includes those two days, the average for the remaining days is lower still.
This is what you would expect if the opening days were weighted toward expensive items. Redseer estimates smartphones contributed about 38-40% of GMV on October 8-9, and electronics orders ran at nearly 14 times normal daily levels, led by laptops and connected devices. As the sale continued, the mix presumably shifted toward lower-value categories such as fashion and everyday items. That is an inference from the averages, not something Redseer has reported, but it is a hypothesis any brand can test against its own order data by day.
Some Festive Electronics Demand Was Pulled Forward Months Ago
In the earlier post, we suggested checking whether a strong sale fortnight pulls forward demand from Dhanteras and Diwali. Redseer’s data points to a different kind of pull-forward as well. It notes that electronics grew more than 20% in the first half of 2026 as consumers accelerated purchases amid expectations of higher prices later in the year. In other words, part of the demand that would normally show up in a festive sale was brought forward to months earlier. That matters for year-on-year comparisons in electronics: festive growth this year may understate full-year demand, because some buyers had already bought earlier in 2026.
Reach Beyond the Metros, Measured in Shoppers
Redseer estimates about two-thirds of first-two-day shoppers came from Tier II cities and rural areas, and it attributes part of that to affordable and regionally relevant assortments, value-commerce platforms, vernacular advertising, and local creators. This is a share of shoppers, not of value. Whether small-town baskets are smaller, larger, or simply different in category mix than metro baskets is a separate question that the published numbers don’t answer, and one that matters for how a brand allocates festive assortment and promotion.
Quick Commerce: Two Trackers, Two Projections
Redseer estimates quick commerce platforms recorded four to five times their usual daily GMV on October 8-9, with 14-15 million consumers shopping through them. Before the season, it had projected quick commerce growing 110-120% year on year and reaching about 18% of festive e-commerce GMV, up from about 11% last year. Datum Intelligence’s pre-season forecast, which we cited earlier, was 16%, up from 12%. The two trackers disagree on both the base and the projection, which is the same point we made about total festive sales: a share or growth figure is only meaningful alongside the tracker, window, and definition behind it. We haven’t found a published actual share for the first leg.
What to Measure With Diwali Days Away
- Break your own orders down by day and by value band. If your average order value fell as the sale progressed, that tells you which products led the opening days and which carried the rest.
- Check whether your category was pulled forward earlier in the year. Compare first-half sales to last year’s, not just festive-window sales, before reading festive growth.
- Compare small-town and metro baskets, not just buyer counts. Category mix and order value may differ more than shopper share suggests.
- Use one tracker consistently, and note whether its window matches the one you are comparing against.
- Plan for the second half of the festive run. Dhanteras and Diwali on November 6-8 will test whether demand held up after a front-loaded sale, and returns and cancellations will clarify how much of the GMV stays sold.
Frequently Asked Questions (FAQs)
What is average order value (AOV) in e-commerce?
Average order value (AOV) is the average amount customers spend per order on an e-commerce platform. It is calculated by dividing the total gross merchandise value or relevant sales value by the number of orders, depending on the measurement definition being used. It helps businesses understand changes in basket value and purchasing patterns.
What did India’s 2026 festive sale reveal about average order value?
Redseer’s estimates suggest that the average order value during the October 8–18 first leg was lower than during the opening two days, October 8–9. Maction’s calculations indicate that the opening period had an estimated AOV of approximately ₹2,700–3,000, compared with an upper-bound estimate of approximately ₹1,900–2,200 for the full first leg.
Why can average order value decline during a festive sale?
Average order value can decline as a sale progresses if the mix of products, purchase occasions and customer segments changes. Opening days may see more high-value electronics and planned purchases, while subsequent days may include a wider range of everyday or lower-priced products. However, brands should validate this explanation using their own order-level data.
How do Tier II cities and rural consumers influence festive e-commerce sales?
Tier II and rural consumers can contribute significantly to the number of online shoppers. However, their contribution to total GMV may differ from their share of shoppers. Brands should examine category preferences, average basket values, purchase frequency and price sensitivity separately across geographic segments.
What should brands measure during India’s festive shopping season?
Brands should track daily average order value, order volume, category mix, price bands, customer segments, geographic differences, returns and cancellations. Comparing these measures across the opening and later stages of a sale can help identify which categories and consumer groups are driving demand.
The Bigger Point
The first leg of this year’s festive sales was large by any measure, and Redseer’s estimates are a useful public read. They are still third-party estimates of platform GMV, not audited sales, and a total tells you little about mix. The most useful detail is the one that falls out of the arithmetic: the average order shrank as the sale widened. For a brand, that turns a market-level headline into a specific question about which of its own products were bought when, and by whom.
If you want category-level research on festive purchase patterns, order mix, or small-town demand, talk to our research team at Maction.