
Hindustan Unilever reports its September-quarter results on Wednesday, October 28, and the run-up has been unsettled: the stock fell 3% on Tuesday to an intraday low of Rs 1,758.60, its lowest level in more than six years. We can’t tell from the coverage what drove the move, and it would be a mistake to read it as a verdict on the quarter. What the previews do give us is a clear picture of what analysts expect, and where they disagree. For anyone using FMCG results as a read on consumer demand, the disagreement is the more useful part.
What Forecasters Expect
|
Forecaster |
HUL revenue |
HUL volume |
| Zee Business estimates | Up 7.3% to Rs 17,430 crore | 6-7% domestic, with pricing about 6% |
| HDFC Securities | Up 11% | Up 6%, led by home care |
| Antique Stock Broking | Double-digit, driven by price hikes | Close to mid-single digits |
Volume expectations cluster in a fairly narrow band, from close to mid-single digits to about 7%. Revenue expectations don’t, running from about 7% to double digits. That spread is partly a question of definitions, since reported revenue and the underlying sales growth HUL leads with can differ, and partly a question of pricing. Most FMCG companies announced fresh price hikes in the quarter on top of those taken in the previous one, and the size of the price and mix contribution is what the forecasters are really disagreeing about. At the sector level, Elara Capital expects volume growth for its FMCG universe excluding ITC to moderate to 9.0% from 9.5% in the June quarter, with commodity inflation pushing up costs.
Last Quarter’s Number Is the Benchmark
In the June quarter, HUL reported underlying sales growth of 10% with underlying volume growth of 5%. By simple arithmetic, roughly half of that headline came from price and mix rather than from more units. That was the starting point for our earlier piece on pack sizes shrinking at both ends of the market. The question for this quarter is whether volume’s share of growth rises or falls from June.
Company Volumes and Consumer Offtake Are Different Measures
Business Standard’s preview notes that companies have been supporting volumes with trade incentives ahead of the festive season. That matters because company-reported volume generally reflects what is sold into the trade, while panel data measures what consumers buy. When incentives are running, the two can diverge, with the company figure ahead of consumer demand.
Industry data published in trade coverage for the same quarter points in a different direction on the rural-urban question. It shows FMCG value growth of 8.6%, a six-quarter high, with rural at 10.6% against urban at 5.8%, and urban value growth climbing from 2.9% in July to 8.2% in September as early festive buying began. In our June-quarter piece, company commentary described urban demand as the main growth driver. The two readings come from different measures, one company-reported and one panel-based, and the second is value rather than volume. Neither is wrong, which is the point: a brand reading a single source may get a different answer from one reading the other.
Margins Are the Other Half of the Story
The same Business Standard coverage notes that crude prices were up 47% year on year in the quarter, and Elara expects a sequential gross margin contraction of about 51 basis points across its coverage because of higher-priced inventory. ICICI Direct expects elevated input prices to keep pressuring margins in the second half of the year, and flags below-normal rainfall as a risk to rural demand. HDFC Securities cautions that the rising need for price hikes could weigh on volumes ahead. Taken together, the previews describe a sector that is protecting revenue with price while hoping volumes hold, which is a more fragile position than the quarter’s headline growth suggests.
What to Read in the Results, and What to Test Yourself
- The gap between underlying sales growth and underlying volume growth. It shows how much of growth is price and mix, and whether that share has risen or fallen since June.
- Management commentary on rural versus urban, and which measure it is based on. Compare it against panel data, not just against other company statements.
- Comments on trade inventory and incentives. These indicate whether festive volumes reflect consumer pull or channel stocking.
- Pack-size and premium commentary. Whether growth is coming from smaller packs at the bottom, premium products at the top, or both, is a question the topline can’t answer.
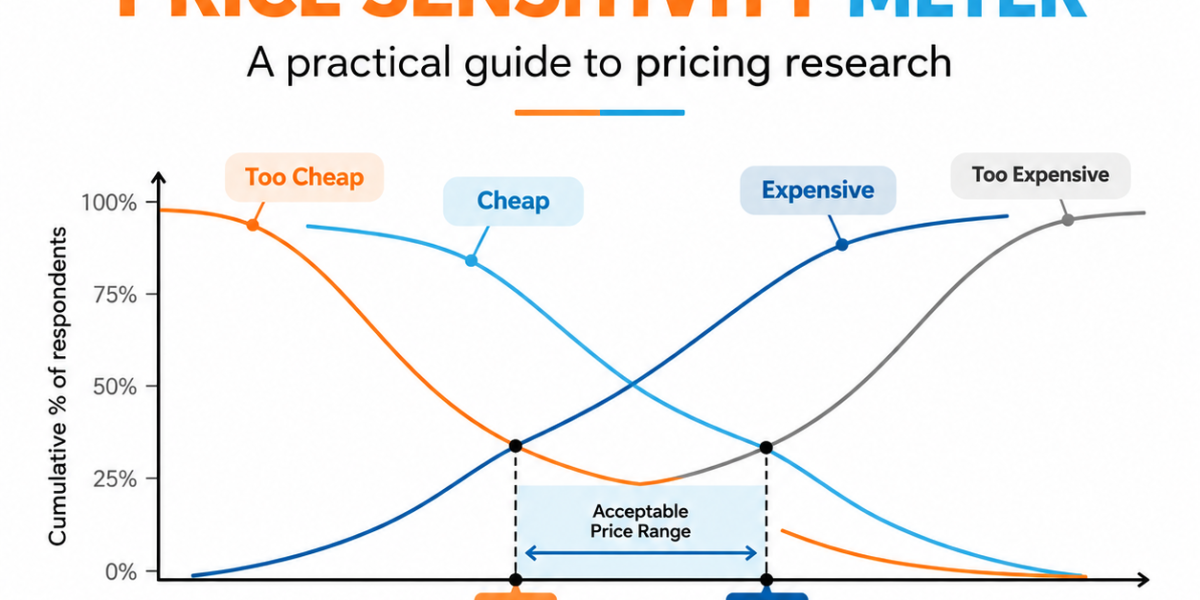
- Signals on further price hikes. Each new hike raises the question of how much volume is lost at the new price point, and that elasticity is something a brand can test directly with its own buyers rather than inferring from a competitor’s results.
- Quick commerce and modern trade share. Both have been described as growing faster than general trade in urban areas, and results commentary is one of the few public reads on how large that shift has become.
Frequently Asked Questions
When does HUL report its Q2 FY27 results?
Hindustan Unilever is scheduled to report its September-quarter (Q2 FY27) results on October 28, 2026.
Why do revenue forecasts for HUL differ?
Revenue forecasts differ mainly because analysts have different assumptions about pricing, product mix and underlying sales growth. The definition used for reported revenue versus underlying sales growth can also contribute to the variation.
What is the difference between company volume and consumer offtake?
Company volume generally reflects products sold into the trade, or sell-in, while consumer offtake measures what shoppers actually purchase. Trade incentives and festive inventory-building can cause the two measures to diverge.
What should investors watch in HUL’s Q2 FY27 results?
The key indicators include underlying sales growth versus volume growth, rural and urban demand, trade inventory, pricing, pack-size trends, margins and further price-hike commentary.
Why is HUL’s volume growth important?
Volume growth helps show whether sales are being driven by higher consumer demand or mainly by price increases and product mix. Comparing Q2 volume growth with the 5% underlying volume growth reported in the June quarter can provide useful context.
How can FMCG brands use HUL’s results for market research?
HUL’s results can provide a broader category signal, but brands can complement them with consumer research on price elasticity, pack-size preferences, channel behaviour and purchase intent to understand how shoppers are actually responding.
The Bigger Point
A results day offers a single, tidy set of numbers, but this quarter the numbers come from companies, panels, and brokerages that are measuring different things and, in places, telling different stories. The brands that learn the most from HUL’s results will be the ones that treat them as one input among several, and that run their own consumer-side measurement of price response, pack-size choice, and channel behaviour alongside them.
If you want category-level research on price elasticity, pack-size shifts, or channel behaviour in your FMCG category, talk to our research team at Maction.